


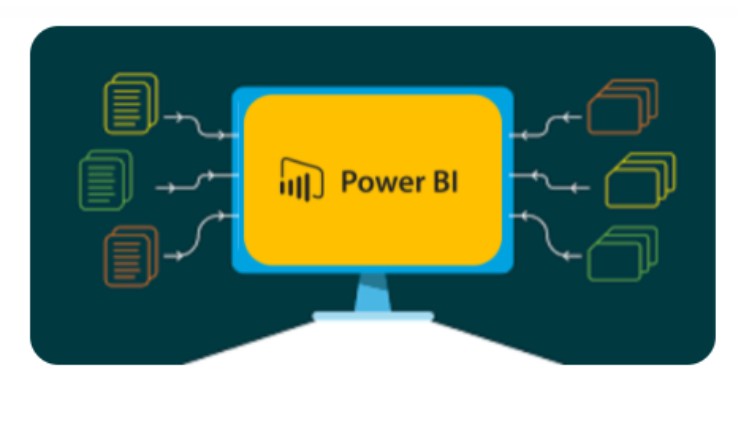
Data Modelling in Power BI
Use Power BI to model and improve data: Learn about the basics of data modeling on Power BI.
What you’ll learn
Data Modelling in Power BI
- Make connections between your data sources.
- Create a new field with a calculated field.
- The best way to improve data is to hide fields and sort visualization data.
- Create a measure that can do calculations on your data.
- Use a calculated table to link two tables together.
- When you format time-based data, you can drill down to get more specifics.
Requirements
-
You should have some knowledge of Excel before you start working with it,
Description
Make sure your data modeling is correct before you can use Power BI to look at your data and make reports. This course lets you look at a toolbox of ways to clean, shape, and load your data. You can use these techniques to clean, shape, and load your own data.
The process of making a complicated data model in Power BI is easy. The more transactional systems you have, the more tables you have to work with. Before you know it, you could have dozens of tables. Building a great data model is all about making sense of the chaos.
One of the most important things that a data analyst can do in Microsoft Power BI is to make a good model of the data that they work with. When you do this job well, you make it easier for people to understand your data, which will make it easier for them and for you to make useful Power BI reports.
Because each piece of data is unique, it’s hard to come up with a set of rules for what makes a good data model. For the most part, it is best to have a smaller data model because it will run faster and be easier to use. It’s also hard to figure out what a smaller data model is because it’s a heuristic and subjective concept.
In most cases, a smaller data model has far fewer tables and far fewer columns in each table that can be seen by the users. Users won’t understand if you import all of the tables from a sales database, but there are 30 total. Five tables are better than 100 columns when it comes to making the data model easier for users. If they open a table and see 100 columns, they might be overwhelmed. Remove unnecessary columns to make the number of columns easier to read. This will make it more likely that the user will read all of the column names. To sum up, you should try to make your data models as simple as possible.
Who this course is for:
- Beginning business analysts.
- Data Analysts who start out.
- There are a lot of people who are new to Microsoft Power Platform.
- For people new to Power BI:
Data Modelling in Power BI
Full Web Ethical Hacking Course
Download Now